Chilliwack Building
A six-year review and data analysis study conducted by RDH Building Science from September 2012 to November 2018 provides insights into conventional roof performance. A discussion of the study findings was presented at the 2020 IIBEC Convention and Trade Show held on June 14, 2020.
The large-scale field monitoring study was conducted along with laboratory testing to measure the impacts and benefits of roof membrane color and insulation strategy on the long-term thermal and hygrothermal behavior and performance of conventional roof assemblies. A two-ply SBS roof membrane system with three different cap sheet colors was installed over three different insulation arrangements for a total of nine unique roof assemblies (see Figure 1). These assemblies were installed on an industrial building located in Chilliwack within the Lower Mainland of British Columbia, Canada.
Chilliwack is in ASHRAE Climate Zone 4. The exterior conditions in this study were taken from Environment Canada’s weather station at the Agassiz Airport, located approximately 35 km (22 miles) from the study site. The average annual temperature at the Chilliwack airport, located approximately 1 km (0.6 miles) from the study site, is 10.5°C (50.9°F). The average July and January temperatures are 18.5°C (65.3°F) and 2.2°C (36.0°F), respectively.[1] Sensors were installed within each of the roof assemblies to measure the material and surface temperatures, relative humidity, moisture content, heat flux, and dimensional stability of the insulation. Table 1 summarizes the insulation arrangements for the three roof assemblies used in the case study.
[1] Environment Canada. Canada Climate Normals (Chilliwack airport). Accessed 2018. http:/climate.weather.gc.ca/climate_normals/
Effects of Roof Membrane Color
Data were collected for all insulation arrangements to evaluate the impact of each membrane cap sheet color (of varying reflectance) and its effect on membrane temperature and heat flow through the assembly. The monthly and daily average temperatures collected during the study show that roof membrane color can have a significant impact on roof membrane temperature, especially in the summer months where a black roof membrane is installed.
The study found a slight trend of increasing inward heat flux (flow) for all membrane colors over the course of the six-year monitoring period. It is theorized that this trend is likely primarily due to the gradual decrease in the thermal performance of the installed polyisocyanurate insulation as it ages. Results also indicate that there is typically more heat flow inward through the assemblies with a black membrane than through the assemblies with a white or gray membrane. This elevated heat flow is due to the relatively more extreme temperatures experienced on the black membrane surface.
One method of assessing the potential energy implications of different roof membrane colors is to use roof surface temperatures to calculate heating degree days (HDD) and cooling degree days (CDD). For this study, calculations were made using the ambient temperature and roof surface temperature to make comparisons between degree days. As an example, a day with a mean ambient air temperature of 70°F (21°C) has 20 CDD. However, if the roof membrane temperature reaches 100°F (38°C), the CDD will be much higher (50 CDD).
The HDD (Figure 2) and CDD (Figure 3) were calculated with a base temperature of 64°F (18°C) and 50°F (10°C).
The data showed a slightly reduced HDD for the black roof membrane due to increased solar absorption and resulting heat gain in the building when compared to the gray or the white roof membrane. However, the lower reflectance of the black roof membrane resulted in a significantly increased CDD (heat flow into the roof assembly). In other words, the darker the roof membrane color, the lower the heating demand on the building, but the more significant the cooling demand on the building.
These results suggest that if energy models consider only the ambient air temperature and do not account for solar absorption on the membrane surfaces, they could yield significantly inaccurate results. Building designers and owners may want to consider how the roof color could significantly alter the balance between heating and cooling demand for a building.
What is a Degree Day?
A “degree day” is the difference in temperature between the outdoor mean temperature over a 24-hour period and a given base temperature.
The CDD base temperature is 50°F (10°C). Where mean temperature is greater than the base temperature, there are as many degree days as the difference between the base and mean temperatures. Example: mean temperature 70°F = 20 CDD.
The HDD base temperature is 64°F (18°C). Where mean temperature is less than the base temperature, there are as many degree days as the difference between the base and mean temperatures. Example: mean temperature 60°F = 4 HDD.
Source: ASHRAE 90.1-2022
Effects of Insulation Arrangement
The monitoring study evaluated the impact of each insulation arrangement on the membrane temperature, interior metal deck temperature, and heat flow through the roof assemblies. It is important to note that the thermal performance of insulation varies with temperature.
Polyisocyanurate insulation typically exhibits strong temperature-dependent conductivity, generally leading to reduced thermal resistance at lower temperatures. Additionally, the aging of polyisocyanurate has also been found to result in a decrease in thermal resistance as blowing agents are off-gassed from the cells of the foam plastic insulation. However, in the time that has passed since the beginning of this study, advancements have been made to the blowing agents used to manufacture polyisocyanurate insulation. The new blowing agents could result in greater stability in the R-value of some polyisocyanurate insulation products. A test performed with modern polyisocyanurate could exhibit a different response than the one observed in this study, depending on the product tested.
While the impact of insulation arrangement on the roof membrane temperature is less significant than the impact of the membrane color, the arrangement does also influence the roof membrane temperature. The most significant impact of the insulation arrangement is in the maximum monthly temperatures. Figure 4 shows the monthly average membrane temperatures for the insulation arrangements. The values provided for each insulation arrangement are the average of the different roof membrane colors for the similar insulation arrangements.
Although it was anticipated that the use of stone wool insulation would result in a roof system with the lowest maximum temperature, generally the roof with the hybrid insulation arrangement had the lowest maximum temperatures throughout the year while the polyisocyanurate insulated roofs had the highest maximum membrane temperatures. The minimum membrane temperatures are similar for the different roof types, but typically the polyisocyanurate insulated roofs experienced the coldest temperatures.
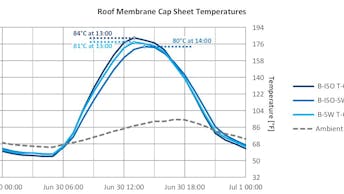
The daily roof membrane temperatures also showed that the roof membrane with polyisocyanurate insulation experienced both the highest and the lowest temperatures over the course of a day. The polyisocyanurate roof assemblies experienced more extreme roof membrane temperatures compared to the hybrid roofs and the stone wool roofs. This result is likely due to the combination of differences in the thermal mass (heat capacity) of the insulation types, the latent energy transfer within the insulation, and the influence of temperature-dependent R-values of the insulation.
To illustrate the impact of insulation arrangement on the heat flow through the assemblies, Figure 5 plots the inward and outward heat flow through the different insulation arrangements, averaged for each month during the monitoring period.
The results showed a slight trend of increasing inward heat flow for both roofs with the polyisocyanurate and the hybrid insulation arrangements. The stone wool arrangement also indicates some increase, though noticeably less than the other two. This trend for the roofs with the polyisocyanurate arrangement likely indicates that the thermal resistance of polyisocyanurate decreased as it aged.
Like the analysis of energy implication due to membrane color, the impact of insulation arrangements was assessed by calculating degree days. The HDD and CDD were calculated using roof surface temperatures with the same values calculated using ambient exterior air temperatures.
Figure 6 shows a reduced HDD for the hybrid insulated roof when compared to the exclusively polyisocyanurate or stone wool-insulated roof assemblies. The roof membrane with polyisocyanurate insulation experienced the coldest minimum temperatures while those with hybrid insulation experienced the warmest minimum temperatures. Figure 7 shows slightly increased CDD for both the hybrid and stone wool roofs, while the polyisocyanurate roof, which experienced the highest of the daily maximum temperatures, had the least CDD. These differences in annual HDD and CDD between the insulation arrangements is likely due to a combination of their thermal mass and latent heat transfer.
Solar Absorption on Membrane Surfaces
While the study results showed no significant difference in the CDD by insulation arrangements, it is noteworthy that energy models of buildings based on ambient air temperatures that do not account for solar absorption on the membrane surfaces could yield significantly inaccurate results.
Moisture Movement in Roof Assemblies
Moisture movement within a roof assembly impacts heat transfer by carrying latent energy with it as it moves within the insulation layers. Figure 8 shows the relative humidity levels below the insulation (i.e., on top of the air/vapor barrier) by insulation arrangement over the course of the six-year monitoring period. The values provided for each insulation arrangement are averaged across different roof membrane colors for similar insulation arrangements.
A trend in the moisture levels within the assembly reveals the predominant direction of vapor drive changes based on the season. During the summer, the top of the insulation is heated, which drives vapor toward the bottom of the insulation. The vapor drive is reversed during the winter.
With all three insulation arrangements, a slight overall year-to-year increase in the relative humidity occurred over the course of the first three years. The relative humidity values appear to stabilize from 2015 onward. This finding likely indicates that it took the roof assemblies approximately three years to reach equilibrium conditions based on the climate to which they were exposed.
To understand how moisture travels on a daily basis, the researchers conducted a targeted review of a 48-hour sample period in the summer and winter of 2017. The plots in Figure 9 and Figure 10 show the relative humidity levels below the insulation, sorted by insulation arrangement, and the average temperature of a black roof membrane.
The daily movement of vapor is more apparent with the stone wool insulation arrangement because stone wool is highly vapor permeable, whereas polyisocyanurate is relatively impermeable and restricts the movement of moisture within the roofs. The plots in Figure 9 and Figure 10 show that vapor is driven from the warmer side to the cooler side of the insulation, and that the direction of vapor movement reverses from day to night. The vapor drive is most significant during sunny and hot days in the summer.
Conclusion
Long-term monitoring studies offer unique opportunities to expand our understanding of the performance of building enclosure materials and assemblies. This study was implemented with the intent of measuring the impacts and benefits of roof membrane color and insulation strategy on the long-term thermal and hygrothermal behavior and performance of conventional roof assemblies.
The relative performance of insulation arrangements was evaluated. The data show a trend of increasing inward heat flow for all insulation arrangements over the course of the monitoring period, with the increase most significant for the polyisocyanurate roof. This trend for the roofs with polyisocyanurate insulation is likely due to aging that resulted in decreased thermal resistance, which is consistent with the laboratory measurements of insulation thermal performance. However, as mentioned, advancements have been made in polyisocyanurate manufacturing during recent years that could contribute to greater stability in the R-value of some polyisocyanurate insulation products. A test performed with modern polyisocyanurate could exhibit a different response than the one observed in this study.
For all three insulation arrangements, a slight overall annual increase in the relatively humidity below the insulation was observed from the end of 2012 to mid-2015. However, the relative humidity levels appear to have reached an annual equilibrium from mid-2015 to the end of 2018.
The impact of membrane color was the greatest during sunny and warm periods. Roofs with higher solar reflectance were generally found to experience less-extreme temperatures and slower changes in temperature. In many cases, the absorption of solar energy by a darker-colored membrane will increase the cooling demand more than it will reduce the heating demand in the winter. Therefore, using a darker-colored membrane can potentially lead to a net energy penalty.
The field monitoring data acquired over the six-year study period provide insight into the different performances of conventional roof assemblies depending on their insulation arrangement and roof membrane color. When selecting the materials for a conventional roof system, it is important to consider the effects those materials will have on the building and roof performance. These effects include building energy consumption, apparent R-values at in-service conditions, and membrane durability.
Project Location
Chilliwack, British Columbia